Sound propagation is the transmission of sound energy through a medium. Sound energy radiating from a point source spreads geometrically, as a result of the expansion of the wavefront, obeying the inverse square law.
Any phenomenon which spreads from a point source equally in all directions without a limit to its range obeys the inverse square law. The intensity of the phenomena at any given radius is equal to the strength at the source divided by the area of the sphere. Being strictly geometric in its origin, the inverse square law applies to diverse phenomena. Point sources of gravitational force, electric fields, light, sound or radiation obey the inverse square law.
Geometric spreading is independent of frequency and has a major effect in almost all sound propagation situations (Smith et al. 1996, 62-67), where sound level is reduced by approximately 6 dB for each doubling of the distance from the source.
Besides the effects of geometrical spreading there are several important environmental factors that affect the propagation of sound. A sound level can therefore be calculated using the following formula:
Lr=LR-20log10(R/r)-E
The first part of the equation is the inverse square law, with Lr as sound intensity at distance r and LR as sound intensity at some known distance R. E, in the second part of the equation, is attenuation factor. Attenuation due to the diffraction over the topography can be approximated using the Maekawa method (Maekawa 1968):
E = 10log10 (3+40f/l)
where l is the wavelength of the sound, and f is the difference in path lengths of sound travelling directly and over the topography (a+b+c-d on Fig. 7). The wavelength is important because higher wavelengths (lower frequencies) are diffracted around the topography more easily.

Figure 7: The principle of a raytracing algorithm
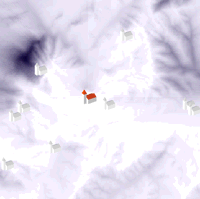
Calculation of f is non-trivial (e.g. it is not available within the current functionality of GIS) and was implemented using a special raytracing routine. The result of the raytracing module is a raster map of 'sound shadows' (Fig. 8), which can be also used for modelling line of sight, as cells with zero values (white on Fig. 8) are visible from the sound source.

Figure 8: 'Sound shadows', as a result of a raytracing algorithm
One of the main drawbacks of the model in its present state is that it only allows for diffraction 'over' and not 'around' the topography. This renders the model unusable for intrasite analysis of architectural spaces.
© Internet Archaeology
URL: http://intarch.ac.uk/journal/issue16/6/notes.html
Last updated: Thur Nov 11 2004