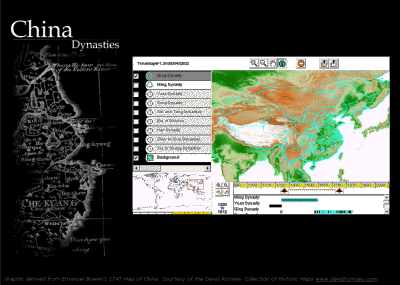
Figure 4: China TimeMap showing time selection and indicators in legend and time bar
Over the last few years, the emphasis in web-based mapping (see Kraak and Brown 2001 for an overview of the field) has shifted increasingly towards interactive map generation and enhanced interactivity. Early web mapping used pre-generated map tiles which could be navigated from some sort of index. The next generation, epitomised by many locator and city mapping services such as MapQuest or WhereIs, deliver a map image selected from a database or generate map images on the fly for delivery as GIF or JPG bitmaps embedded in an html page. Each change in the map, however small, has to be sent back to the server for regeneration of the image. This approach is typically limiting, although there are some advantages in being able to carry out server-side processing of complex queries rather than downloading data to the client (for an archaeological example, see D'Andrea et al. 2001).
In the last couple of years we have seen the rise of browser-based map viewing clients, often written in Java, which ask a server for raw data for each layer rather than pre-assembled map images. Typically the server is separate 'middleware' which sits between the client and the (often multiple) sources of data. The clients use GIS principles of geographical coordinates, map layers and layer rendering to assemble and display an interactive map. These maps can be zoomed and panned, their layers can be switched on and off or reordered, and their symbology can be changed on the fly. Many of these operations can happen instantly without reference back to the server and/or can be carried out in the background with user interaction through multi-threading (Yorston 1999). While most web mapping clients are currently written in Java, other browser- or plugin-implemented languages, such as Scalable Vector Graphics (SVG) and Shockwave Flash (SWF), are beginning to appear.
The best web-mapping applications have sophisticated algorithms for compression and caching of data already obtained from the server and requesting just the new data needed as the area of interest or map layers are changed. However, to the best of my knowledge, all generally available web-mapping solutions take an atemporal view of map data. If time is to be represented, it must be represented through different map layers for different periods or time slices. No general-purpose client yet has map animation capabilities. Most web map servers serve only from a limited range often proprietary of data formats, although the development of Open GIS Consortium standards for map, feature and catalogue serving are increasingly breaking down the barriers between systems.
Despite these limitations, web map servers offer an enormous potential to move from static pre-packaged web sites to the delivery of interactive maps, allowing the viewer to interrogate a database on the fly. The importance is not so much the availability of such resources online, but the ability to build the applications as front-ends to substantial databases, rather than as canned applications with limited data. In addition, the use of flexible general-purpose software to deliver data derived from a database opens up the possibility of delivering the same data in several ways – for example, as a museum kiosk application integrated with exhibits and, at the same time, available for searching on the web through an intelligent client applet (see for example, Sydney TimeMap in section 6.1).
The TimeMap Java map viewer, TMJava, is a client-side web mapping applet which can make on-the-fly time-based, spatial and attribute selections from datasets registered with the Electronic Cultural Atlas Initiative (ECAI) metadata clearinghouse. The TimeMap middleware supports a variety of common data formats, including ESRI shapefiles, GIF and JPG images, MrSID image server, several SQL data servers and the Open GIS Consortium WMS standard.
The data downloaded by TMJava is dynamically filtered within the applet, under the control of a draggable time bar (Figure 4). Layers which have a limited time span (such as specific scanned map images or datasets covering a specific date range) are enabled and disabled according to whether they fall within the currently selected time range. The applet can thus display all applicable data for a selected time range through simple, intuitive user interaction. This unique capability is illustrated in Sydney TimeMap.

Figure 4: China TimeMap showing
time selection and indicators in legend and time bar
In addition to the ECAI metadata clearinghouse, implemented using an SQL server database, TMJava can operate with a local clearinghouse stored as an XML file. This capability was developed as a direct result of the selection of TMJava by the Macquarie Library to provide a spatial search of their online encyclopaedia, MacquarieNet, described in section 6.2. Development of an XML clearinghouse allows TMJava and the supporting software to be dropped onto a new server without the need to install an SQL server database to hold the clearinghouse, and reduces dependency on proprietary data formats and software, which will rapidly become obsolete.
Last updated: Wed Sep 11 2002
© Author(s). Content published prior to 2013 is not covered by CC-BY licence and requests for reproduction should usually go to the copyright holder (in most cases, the author(s)). For citation / fair-dealing purposes, please attribute the author(s), the title of the work, the Internet Archaeology journal and the relevant URL/DOI.