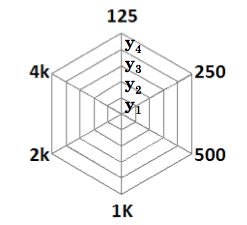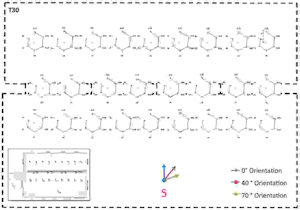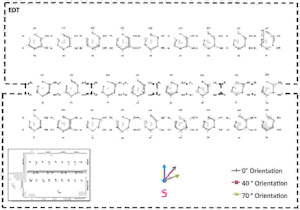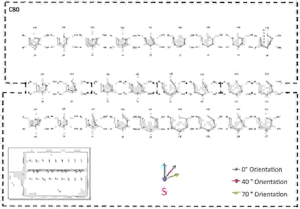
This measurement and modelling process results in a multi-acoustic parameter dataset that varies with frequency, model/measurement scenario and spatial position, making more comparative analysis and interpretation difficult to achieve. Data visualisation is often used to help in these cases, and we have developed a novel method based on acoustic floor maps (Foteinou and Murphy 2014) to help represent this multivariate dataset that combines position and frequency dependence for each acoustic parameter in a single plot. These acoustic floor maps use a radar chart, as shown in Figure 20, centred at each of the 26 measurement positions, with acoustic data presented clockwise across 6 octave bands, 125Hz, 250H, 500Hz, 1kHz, 2kHz and 4kHz.


Three acoustic parameters are presented in Figures 21, 22 and 23, respectively T30, EDT and C80. T30 is equivalent to the generic term RT60, but derived more specifically from an impulse response measurement according to ISO3382-1 (2009). EDT is an equivalent measure of RT60, but takes into account the early sound of the impulse response, rather than just the reverberant decay, and so gives an indication as to what impact early reflections have on the overall acoustics of the space, in particular in relation to the perception of the reverberant decay. C80 is also referred to as clarity and is a measure of the overall acoustic energy arriving at the listener before and after 80ms. Positive measures of C80 indicate more energy in the early sound, rather than the late, with the implication that the sound source will be perceived more clearly. Negative values of C80 indicate the converse, with the late reverberation dominating, meaning that, for instance, speech might be difficult to understand owing to the reverberation in the space causing words to blend together, noting also that this might be favourable for certain forms of music.
The results of each acoustic parameter are demonstrated on the corresponding acoustic floor map, representing the values across six octave bands for each individual measured position. It can be observed that T30 values are not affected by the orientation of the sound source. EDT values have minimal changes, especially at those positions where physical characteristics of the space (such as walls or columns) combined with the effects of the source orientation influence the energy of the early reflections. However, early reflections appear much stronger than the direct sound when the source is orientated from 0°, 40° and 70°, resulting in wider variations in C80.
Internet Archaeology is an open access journal based in the Department of Archaeology, University of York. Except where otherwise noted, content from this work may be used under the terms of the Creative Commons Attribution 3.0 (CC BY) Unported licence, which permits unrestricted use, distribution, and reproduction in any medium, provided that attribution to the author(s), the title of the work, the Internet Archaeology journal and the relevant URL/DOI are given.
Terms and Conditions | Legal Statements | Privacy Policy | Cookies Policy | Citing Internet Archaeology
Internet Archaeology content is preserved for the long term with the Archaeology Data Service. Help sustain and support open access publication by donating to our Open Access Archaeology Fund.