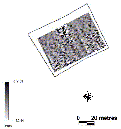

Fig. 6.1 Resistivity survey, fields 32 and 45 (Site 2/31) &
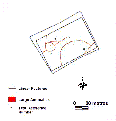
Fig. 6.2 Interpretative plan of resistivity survey, fields 32 and 45 (Site 2/31)
Editor's note: many image links in this section will open a second browser window.
The aim of utilising geophysical survey techniques in the survey was to allow further analysis of areas where high concentrations of Iron Age and Roman pottery and tile had been located. Areas with high density of pottery were selected for further survey where the field conditions were appropriate for resistivity or magnetometer survey. A series of small sites were thus examined in the fieldwork seasons in September 1995, and further magnetometer surveys were undertaken in September and October 1997.
View all the geophysics data (17 records)
Download the geophysics data from the digital archive
(link opens new window)
A number of factors limited the quality of results from geophysical survey, mainly related to the geography and geology of the region. Field sizes meant that the areas available for geophysical survey were generally small. Small terraces meant that some areas could only be surveyed in 'keyholes', limiting any contextual appreciation of the results. The nature of the surface geology of the area also affected the results of magnetometer surveys. The underlying geology generally comprised micaceous granite of volcanic origin, which in some cases masked any potential archaeological anomalies with large positive and negative features. This was compounded by major variations in soil depths resulting from erosion and terracing (see Table 2.2). Many archaeological features, for instance the roundhouses in the castro at Terroso, are built from local granite (Fig. 3.3), which will not have enhanced their visibility against the background geology.
Finally localised environmental effects also hindered the acquisition of clear survey results. Very dry soils prevented success in the collection of resistivity data, whilst large variations in ground temperature affected magnetometry survey, with much drift in the readings, particularly towards mid-morning each day.
Both resistivity and magnetometry surveys were undertaken in this area in September 1995. Results were affected by the nature of the topography of the fields, in particular where the ground sloped to east and west away from a ridge formed by the original field boundary between fields 32 and 45.


Fig. 6.1 Resistivity survey, fields 32 and 45 (Site 2/31) &
Fig. 6.2 Interpretative plan of resistivity survey, fields 32 and 45 (Site 2/31)
Despite large observed variations in readings, the resistivity survey successfully recorded broad changes in soil resistivity across the two fields (Figs 6.1 - 6.2). In particular a range of anomalies was suggested. A sub-circular anomaly was noted in the north-west corner of the survey grid [1], around 13m in diameter, comprising an outer edge of low resistance readings, surrounded by higher readings.
A low resistance linear feature was located, running in a south-west to north-east direction [2], to the north-west and west of the sub-circular feature. Similarly, a linear feature was noted running in a west to east direction, perpendicular to the line of the other feature [3]. A large curvilinear feature was also noted in the south area of the survey [4], cut by a linear anomaly at the east side [5]. The clarity with which these discrete anomalies could be viewed was partially masked by the broad changes in soil resistance across the survey area, marked by high and low resistance bands of readings.
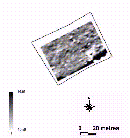
Fig. 6.3 Magnetometer survey, fields 32 and 45 (Site 2/31)
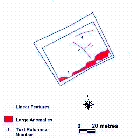
Fig. 6.4 Interpretative plan of magnetometer survey, fields 32 and 45 (Site 2/31)


Results of the magnetometer survey showed no obvious correlation with those of the resistivity survey (Fig. 6.3). A large number of bipolar readings obscure the survey area. In addition, the proximity of a steel wire in the southern field boundary produced large magnetic readings, distorting the results in this area [1]. A large positive anomaly across the south-east edge of the survey area may be due to interference from ferrous material in the boundary wall, or may illustrate the existence of a geological feature running under the field boundary (Fig. 6.4). A slightly narrower positive anomaly running in a north-west to south-east direction [2] may mark the original boundary between fields 32 and 45, although this is not certain. A linear feature appears to run from the middle of [2] to the north-east [3]. A similar line can also be observed in the north-east area of the survey [4].
© Internet Archaeology
URL: http://intarch.ac.uk/journal/issue9/millett/geophys.html
Last updated: Sat Dec 30 2000